“How do I measure a culture of safety in my warehouses?”
You want to keep people safe, but reporting on the impact of your safety programs is a challenge that every EHS and logistics leader faces.
Let’s walk through a step-by-step playbook showing how our best customers measure their warehouse safety programs and turn their EHS trend reports into value packed, actionable improvement plans — all backed by data.
Looking for ways to analyze and report on the ROI of your forklift safety program? Check out this guide.
How it works
Pick your key warehouse safety KPIs
Look at your overall network safety trends
Perform a root cause analysis (RCA) of your network safety incidents
Analyze specific safety trends at your best and worst sites
The Playbook
Step 1: Pick the KPIs that matter for your warehouses
First things first, you have to figure out what you want to measure and report on.
Most warehouse safety plans track KPIs like OSHA TIR and number of incidents or forklift impacts. But you shouldn’t stop there, incidents are a lagging indicator of warehouse safety, and to truly measure how effective your program is, you need a more holistic view.
Consider pulling together data on near misses (or what we call leading indicators of MHE safety events).
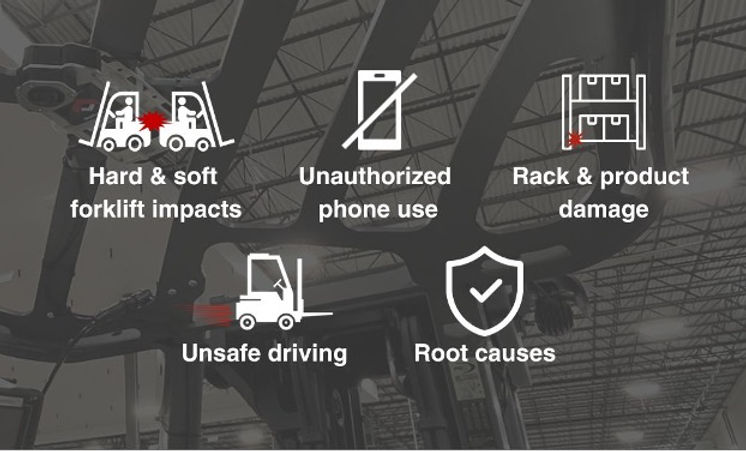
From there, I recommend going a bit deeper. What are the specific types of incidents and root causes of accidents in your warehouse network? Look at things like:
- Phone use
- Hard and soft impacts
- Product and rack hits
- Unsafe driving and dockplate maneuvers
- Root causes of safety incidents
This allows you to get very granular in your reporting, focus your efforts on what matters most for your network, and come to the table with an action plan that leadership will love.
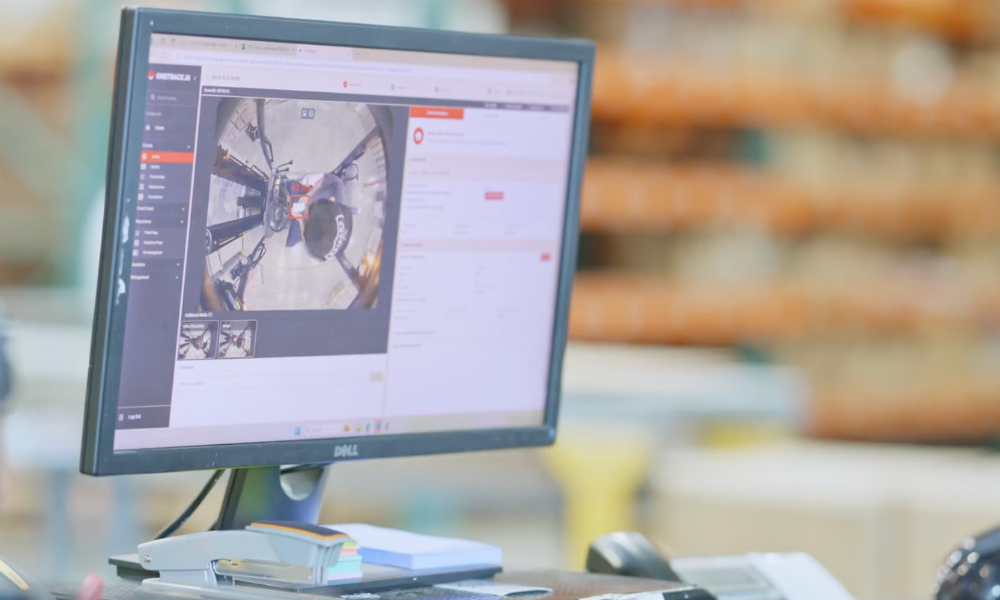
Want to see for yourself how OneTrack actually works? Check out this interactive safety product tour.
Step 2: Look at your overall network safety trends
Once you have the KPIs set, it’s time to dig into the data. Let’s break down a few of the reports our most successful customers use.
First up, I like to start with the LSW Network Overview dashboard for, well… an overall network view. This gives you a birds eye view of your network performance in terms of safety, productivity, and quality, and then you can drill into specific sites depending on what trends you’re seeing.
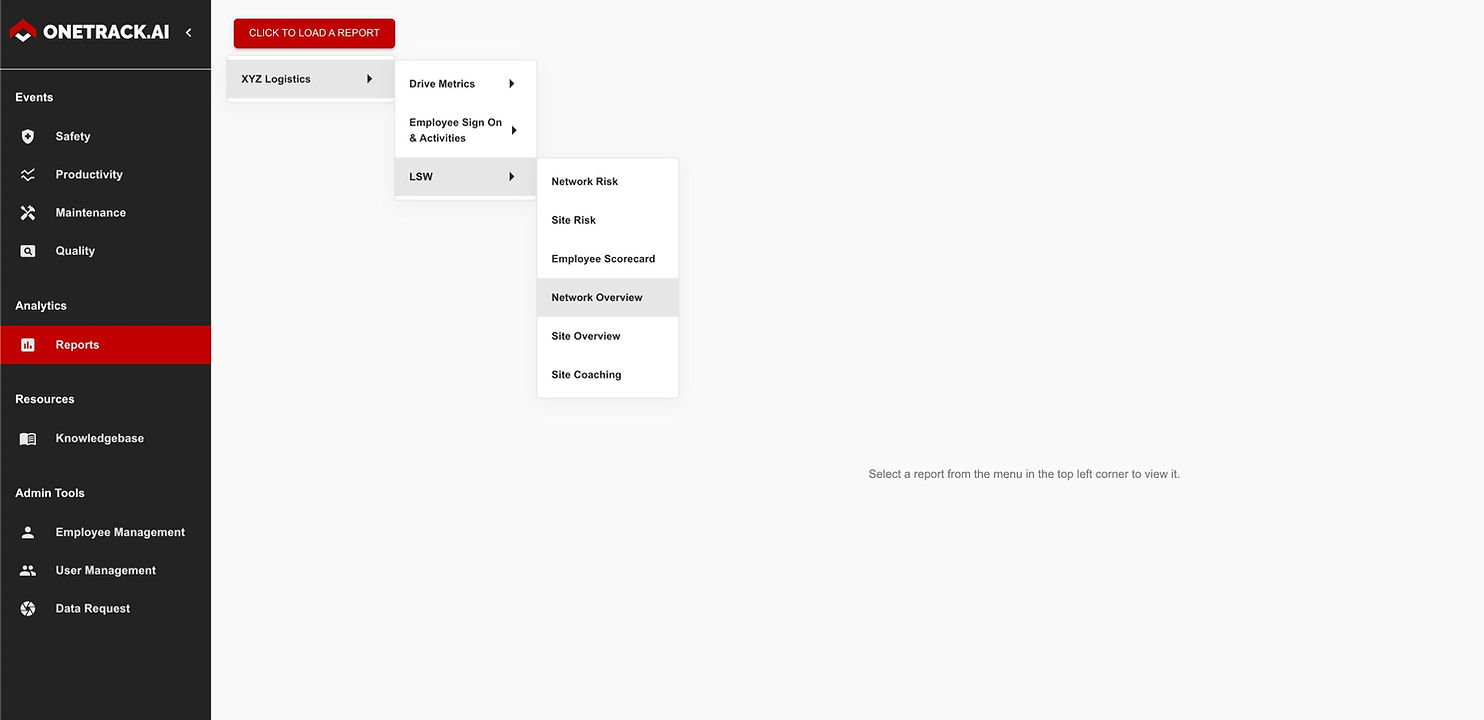
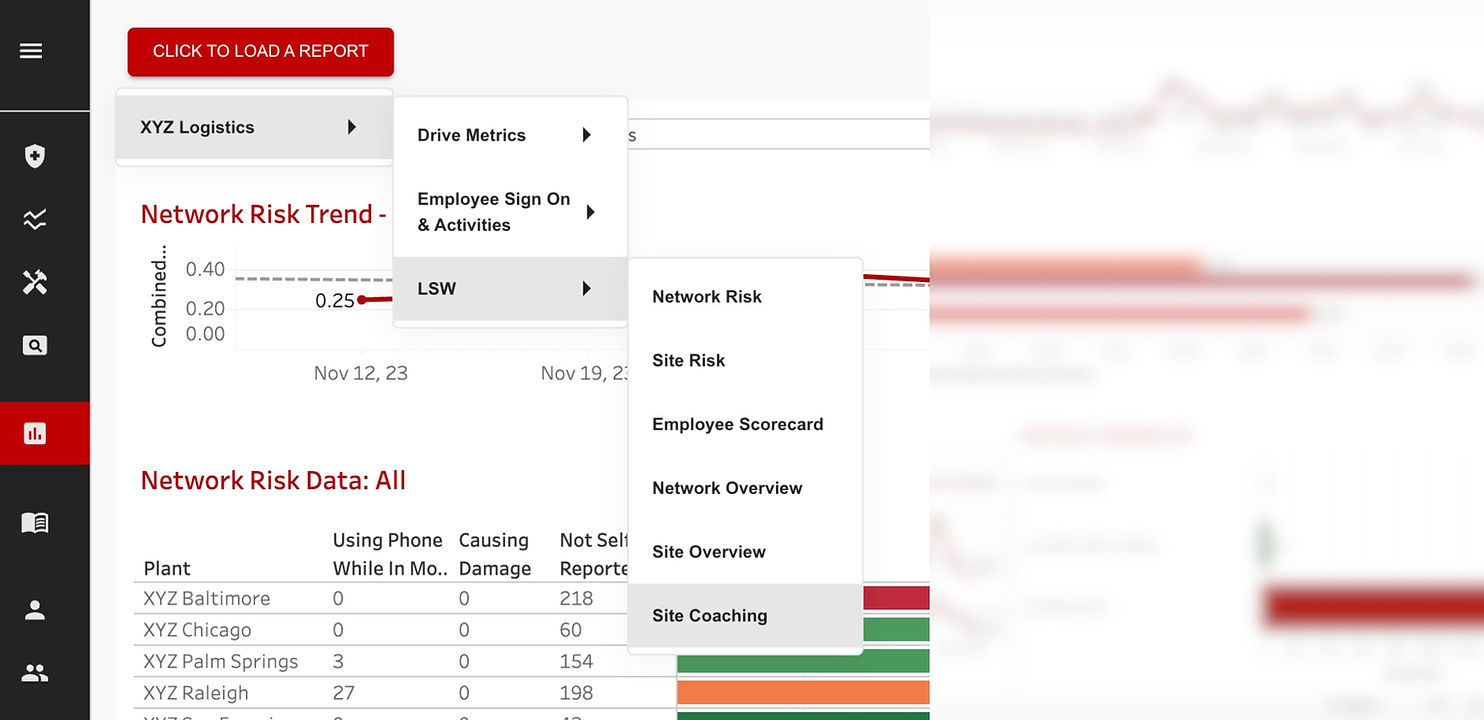
Hop into the OneTrack platform, and then head over to Reports > Click to Load a Report > LSW > Network Overview.
First thing you want to do is change your event filter to "Total Number of Safety Events"
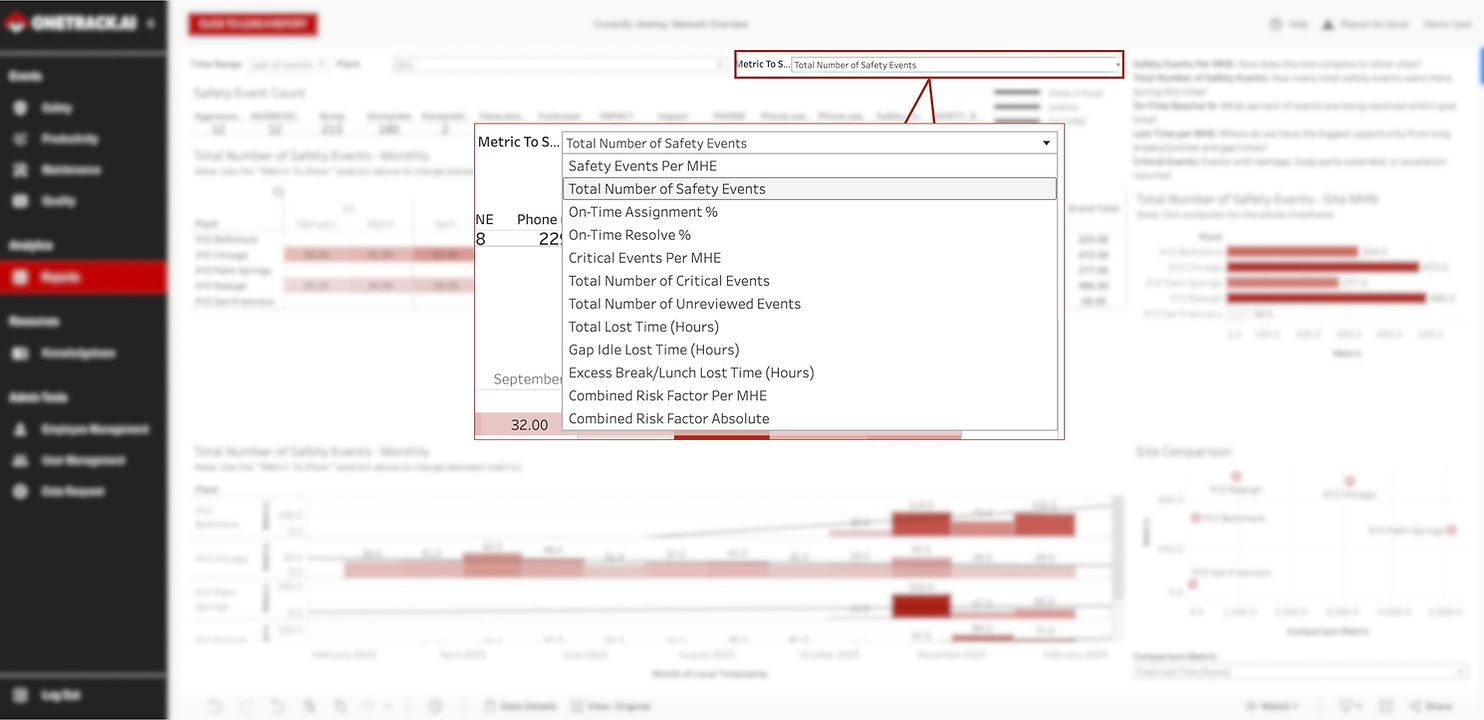
This will show you some key insights into your warehouse network safety:
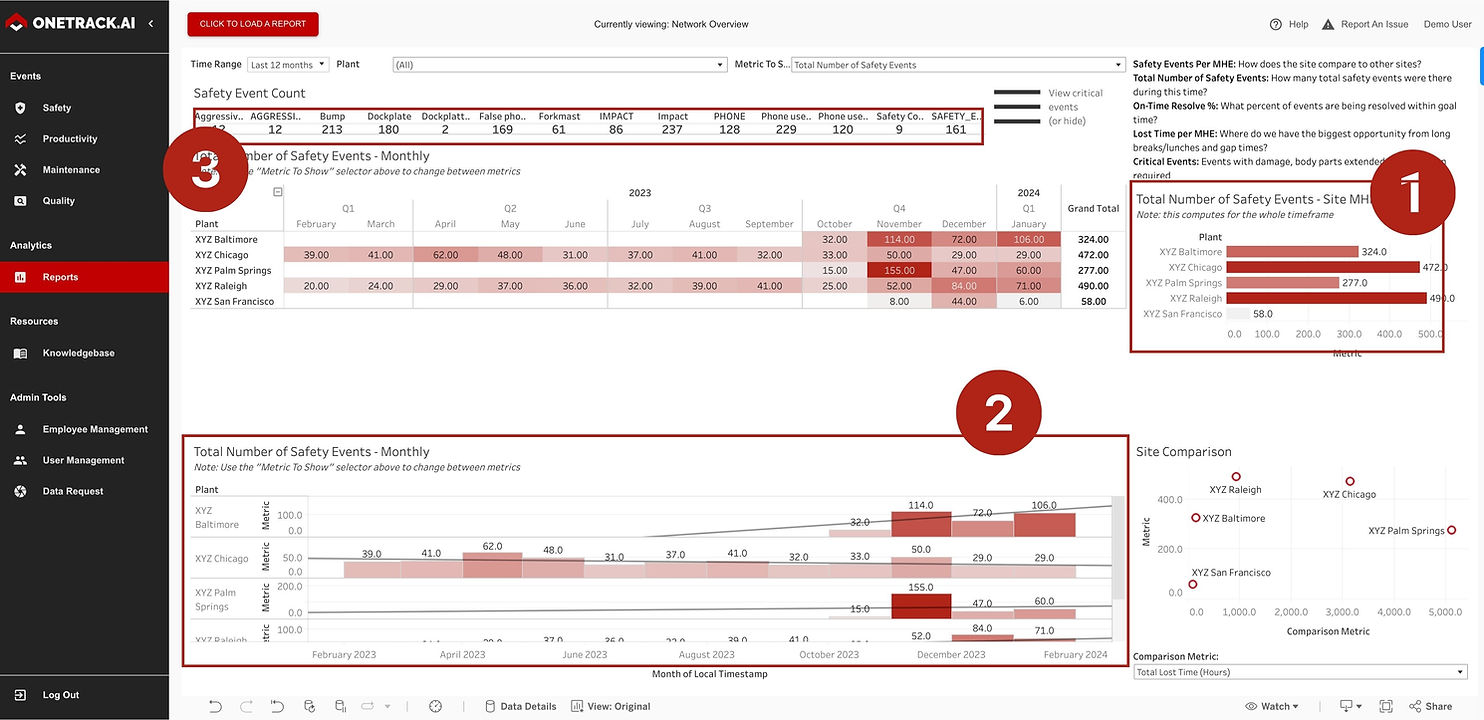
- Total number of safety events by site
- How sites are trending from a safety event perspective
- And you can filter by event type to only look at things like # of impacts, phone use, dock plates, and more.
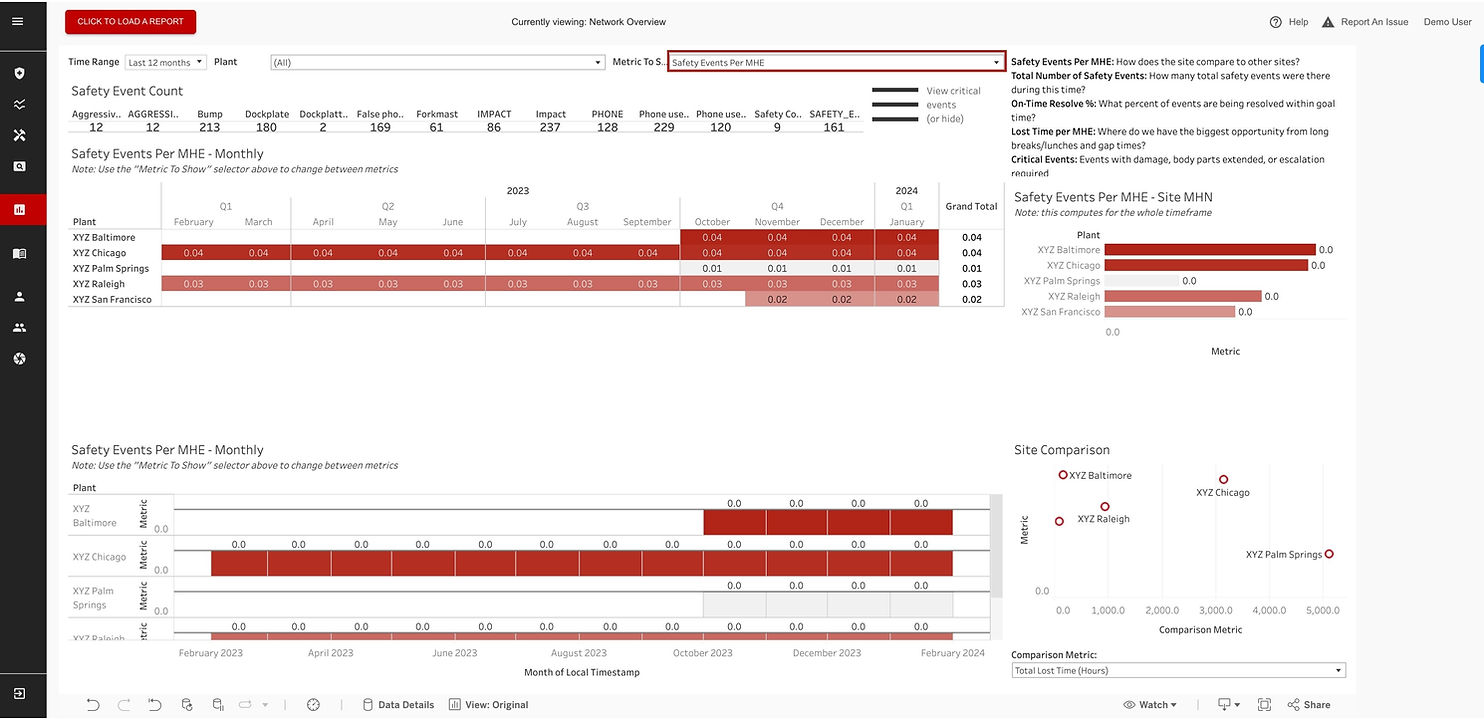
The next piece to check is to filter the dashboard by “Safety Events per MHE”. This will show you the same data, but this time taking into account the number of MHE at each site so you can see the true safety value of each site.
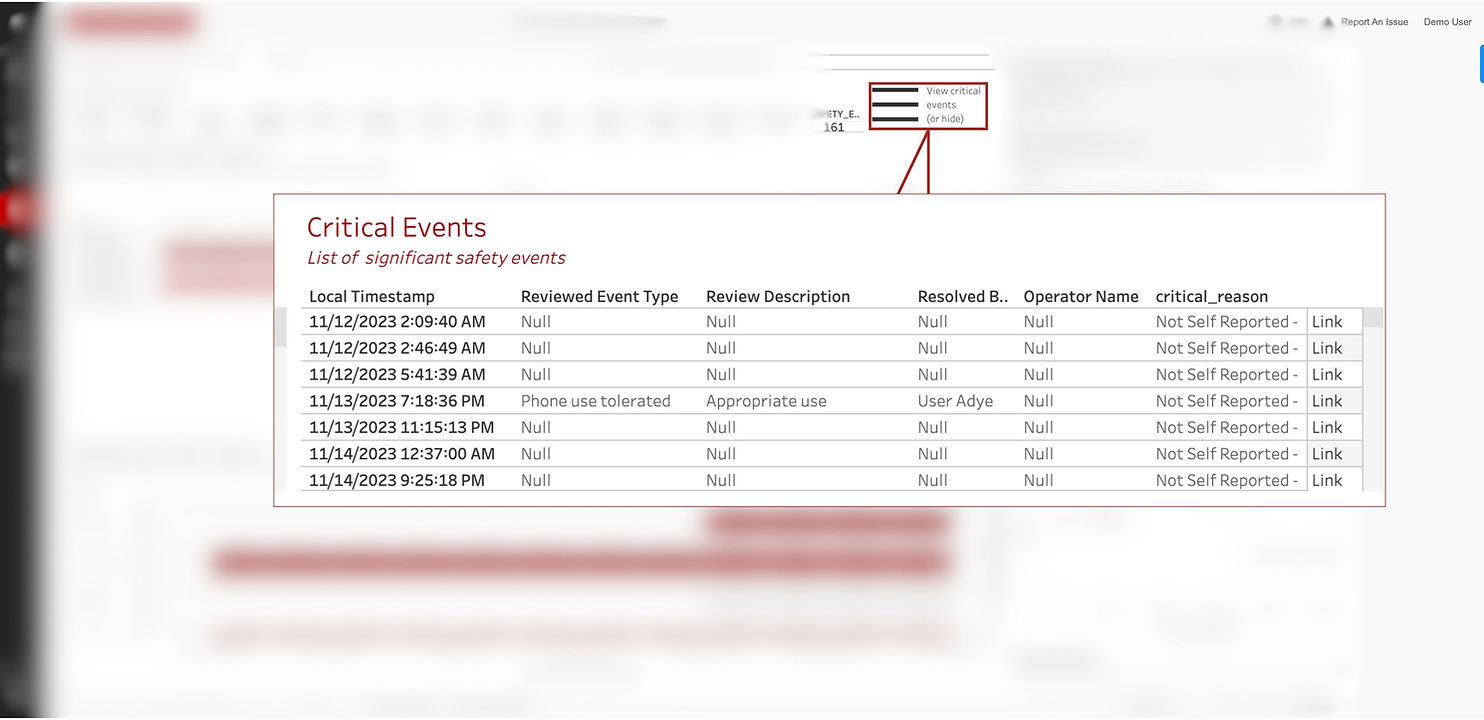
Then I recommend looking through any “Critical Events”. These are any safety events that caused serious injury or property damage, and you can see which sites have the most serious accidents.
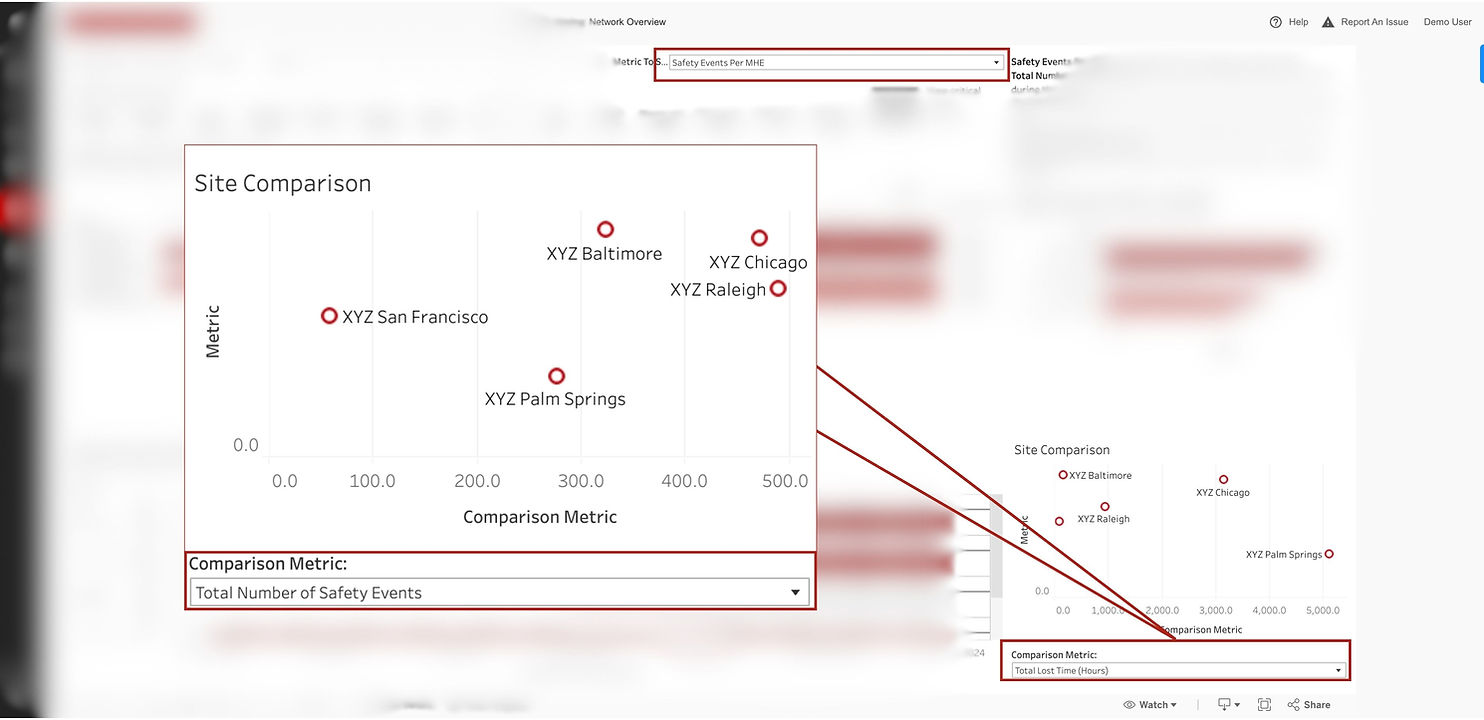
Lastly, do a site comparison on this dashboard view, and filter by “Total safety events”. This stack ranks your warehouse safety events by site while taking into account how many MHE are actually at each site.
After looking through this, take note of which sites are your best and worst from a safety perspective. We’ll deep dive into those later in the guide.
Step 3: Perform a root cause analysis (RCA) for your network
Now that you have the data on the overall network safety trends, it’s time to do a root cause analysis of safety incidents across your network. This shifts the focus from scrutinizing people to scrutinizing processes.
There’s a time and a place for evaluating specific operators, but for this guide, we’ll focus on scrutinizing processes to make wholesale improvements based on network data.
Pop over to the LSW - Network Risk report and take a note of:
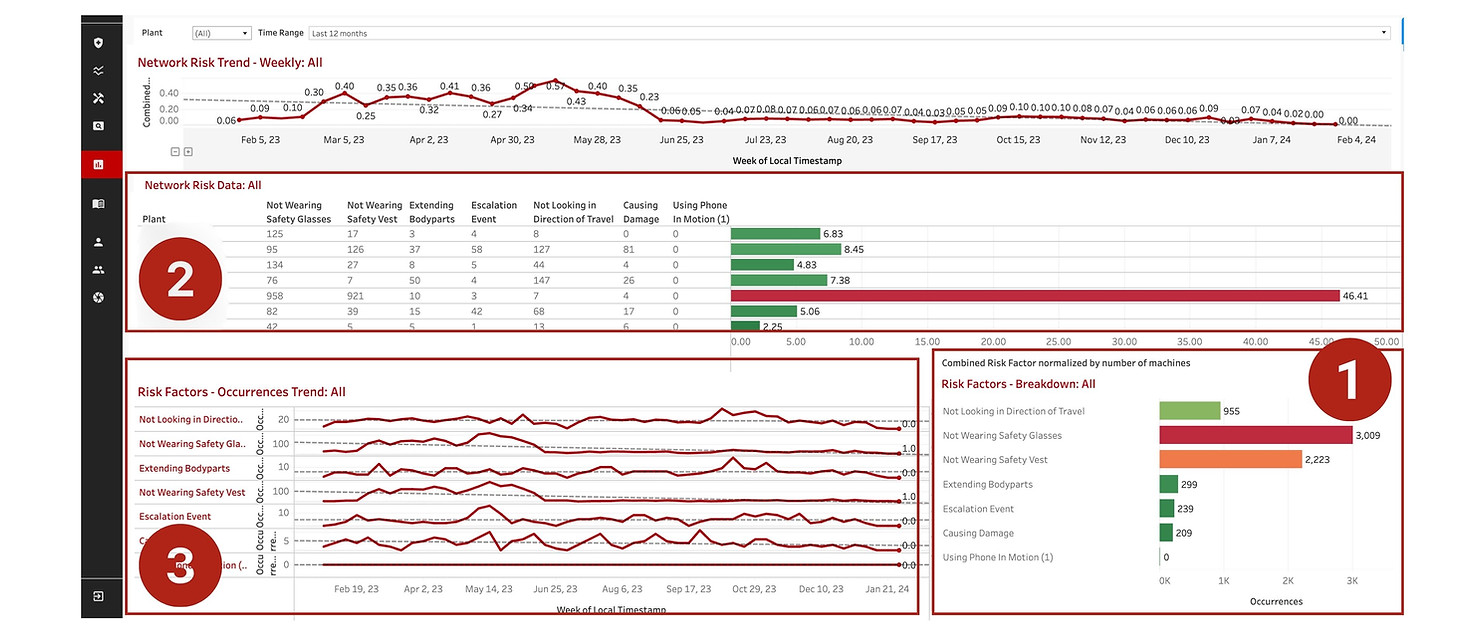
- Breakdown of the total number of risk factors to see what the focus network wide needs to be
- If there are any sites that have unusually high risk factor categories, for more tailored training
- Overall network trend by risk factors, to see the effectiveness of your training programs
This dashboard helps you get more specific when it comes to planning out safety initiatives (and makes you look great when presenting to leadership).
Instead of just knowing the number of impacts, you can see why those impacts actually take place, and come armed with data-driven solutions instead of problems.
For example, I can see my top two risk factors in my network are: not looking in the direction of travel and not wearing safety glasses and vests. This is a serious risk of accidents involving pedestrians!
With that, I can suggest to leadership that we do more specific training around MHE fundamentals, implement stricter PPE processes, and consider bringing in complimentary technology like back-up cameras with proximity alarms.
Step 4: Analyze specific safety trends at your best and worst sites
Remember the sites that stood out when you were looking at network performance?
Let’s dig in and get more details. Are there patterns for what makes your best sites your best sites? What about insights into why your worst sites are struggling?
Instead of coming to the meeting with problems, we want to come armed with solutions.
Click over to the LSW > Site Coaching. Then filter by the sites you want to see.
A few important things to look at here:
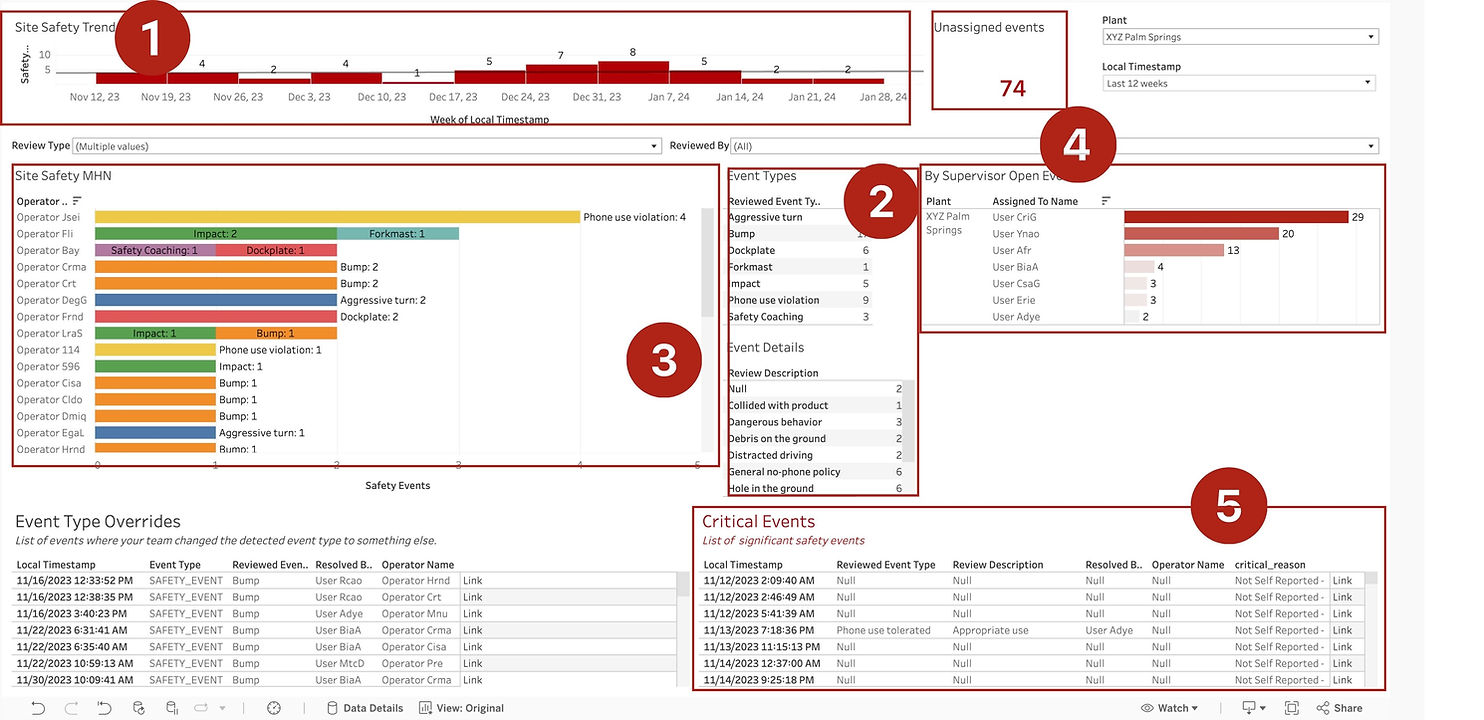
- Overall site trend. Is it steadily decreasing or increasing?
- Event type trends (Filter by event type by clicking on them). Are there outliers? Is it a coaching problem or a deeper process improvement that’s needed?
- Which operators are involved in the most safety events? Is there more coaching needed, a process change, or does HR need to get involved?
- Open and unassigned events. Are supervisors actively coaching and resolving events in a timely manner?
- Critical events. From the dashboard you can easily click and see the footage of these critical events to see exactly what went wrong and what processes may need improving at that facility (or investigate a workers comp claim with video evidence).
Want to put this playbook to work for yourself?
Using this playbook will make reporting on your forklift safety program a breeze.
In just a few minutes you now have data on:
- Your overall network trends for safety
- How you're trending with specific event types
- The leading indicators and root causes of safety incidents your network (and a plan to address them)
- A deeper analysis of your worst performing sites and an action plan for improvement
Now that’s what Warehouse Intelligence is all about.
One platform to easily view how your warehouses are performing in terms of safety, report on success, and come to the table with actionable data to help improve performance and keep people safe.
Want to put this kind of data to work in your warehouses?
OneTrack customers, good news! You already have this at your fingertips. Reach out to your implementation manager or support team with any questions.
If you aren’t a OneTrack customer, book a custom demo here. We’ll connect to better understand your operations and show you what a partnership could look like.